Blog Nº 001 | Why Brand Matters: The Business Behind Perception.
July 2026 · 2,282 words · 11 sources · 0 fabricated figures
This brief makes claims about money. Claims about money should be checkable.
Every figure comes from an audited financial statement, a peer-reviewed journal, or the primary publication of the institution that produced the research. Sources appear as footnotes, beside the claim they support. Where a source has a commercial interest in its own conclusion, we say so in the text.
CHAPTER I
The Finding Almost Nobody in Marketing Cites
The most persuasive evidence that brand affects business performance was not produced by anyone in the brand business.
In 2013, Yelena Larkin published a paper in the Journal of Financial Economics — one of the three most demanding journals in the discipline. She was not asking whether branding is a good use of a marketing budget. She was asking what determines a company’s financial policy: its leverage, its cash holdings, its credit rating.
Her findings:
— Strong brand perception reduces the volatility of a firm’s future cash flows.
— Firms with strong brands held their cash flows steadier through the 2008–09 recession, with a profitability advantage of roughly 2.07 percentage points over weaker-brand peers.
— Strong brand perception improves credit ratings for firms that would otherwise be treated as risky — closing the ratings gap by more than a third of a notch for each standard-deviation increase in brand stature.
— And the finding that should stop any founder reading this: the effect of brand is stronger among small firms, not large ones.
“In effect, that a brand is a mechanism for reducing the riskiness of a business. Not for making it more appealing. For making it more predictable. ”
The mechanism
The chain is short, and almost never stated. Preference reduces the price-elasticity of demand. Less elastic demand means revenue that does not collapse when the market turns. Cash flows that do not collapse are cash flows a lender can model. Cash flows a lender can model command better terms. Better terms mean more capital, at lower cost, to reinvest — including in the perception that started the chain.
That is not a marketing loop. It is a capital loop.
FIGURE 01
The Capital Loop
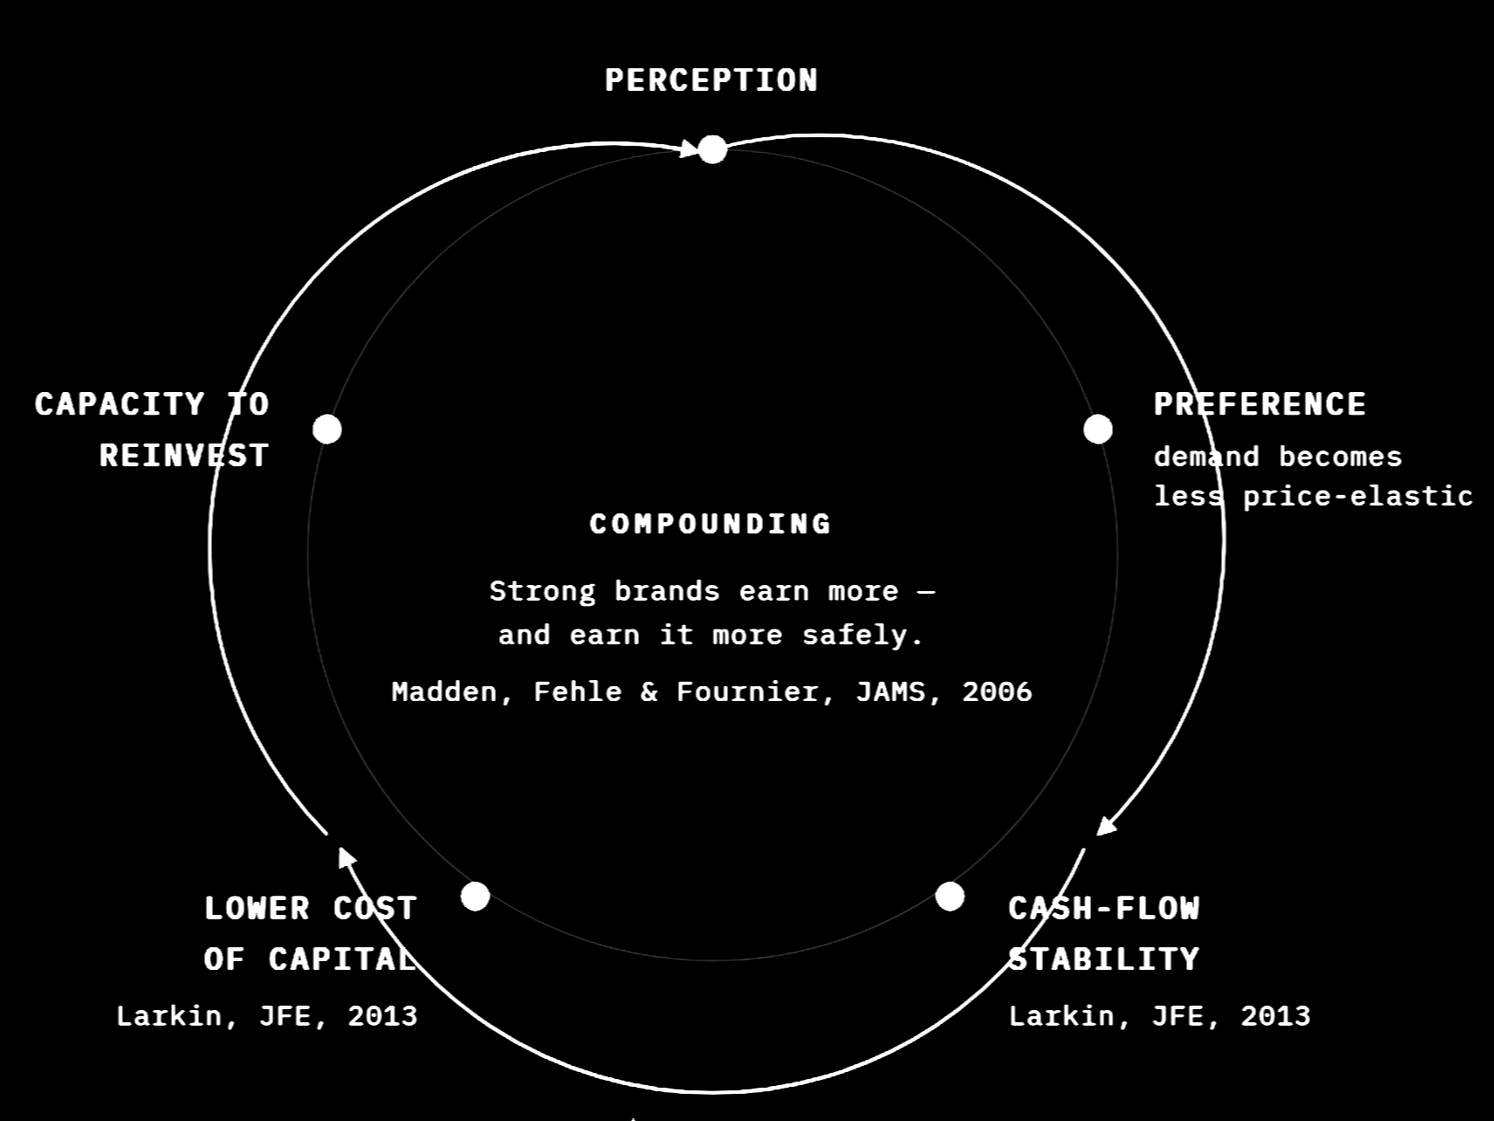
Two independent literatures — finance and marketing, seven years apart, different data, different methods — converge on the same conclusion. Strong brands do not simply earn more. They earn more, more safely.
SOURCE Larkin, Journal of Financial Economics, 2013 · Madden, Fehle & Fournier, Journal of the Academy of Marketing Science, 2006.
The result does not stand alone. In 2006, Thomas Madden, Frank Fehle and Susan Fournier applied the Fama-French method — a standard tool of empirical finance — to companies with strong brands. Those companies delivered greater returns to shareholders than a relevant market benchmark, and did so with less risk. The finding held after controlling for market share and firm size. (2)
“Brand is a risk-management asset that happens to be built with creative tools and the branding industry rarely makes.”
That sentence is the argument that survives a boardroom. “It will improve our positioning” does not survive contact with a chief financial officer, and it should not. “It will reduce the volatility of our cash flows, improve our terms of credit, and the published evidence says the effect is strongest in companies our size” is a different conversation — and it is the one the evidence actually supports.
Which raises the obvious question. Why would something as soft as perception do something as hard as that?
(2) PEER-REVIEWED. Madden, T. J., Fehle, F. & Fournier, S. (2006). "Brands matter: An empirical demonstration of the creation of shareholder value through branding." Journal of the Academy of Marketing Science, 34(2), 224–235. https://journals.sagepub.com/doi/abs/10.1177/0092070305283356
CHAPTER II
Perception Operates Below Articulation
To answer that, we have to deal with a disagreement the branding industry mostly pretends does not exist.
The conventional position holds that brands work through meaning: people buy identity, belonging and story, and the product is the vehicle. Most of the industry is built on this assumption.
The Ehrenberg-Bass Institute holds that this is largely fiction. In 2007, Jenni Romaniuk, Byron Sharp and Andrew Ehrenberg published evidence spanning many categories and two countries showing that consumers perceive very little difference between competing brands — and buy them anyway. Differentiation, they concluded, plays a far more limited role than the orthodox literature assumes. What matters is distinctiveness: being easy to notice, recognise and recall.
That paper is inconvenient for most of the branding industry. It is also, on its own terms, correct, and it has never been meaningfully refuted.
So which is it. Is brand meaning, or is brand memory?
The question is badly posed
Two experiments, both from outside marketing, both published in journals with no stake in the answer.
In 2004, a team led by Samuel McClure gave people Coca-Cola and Pepsi inside an fMRI scanner. Delivered anonymously, preference tracked activity in the ventromedial prefrontal cortex. When the brand was revealed, knowledge of one of the drinks dramatically altered both stated preference and measured brain response.
In 2008, Hilke Plassmann and colleagues scanned subjects tasting wines while being told the price. Some wines were identical; only the stated price changed. Told a wine cost $45 rather than $5, subjects reported it as more pleasant — and activity increased in the medial orbitofrontal cortex, the region understood to encode experienced pleasantness.
Read that slowly, because the usual summary of it is wrong. The subjects did not decide to enjoy the expensive wine more. They enjoyed it more. The price did not decorate the experience. It became the experience.
Perception is not what people say about a brand. It is what happens to people when they encounter it — usually below the level at which they could report it, and often in direct contradiction to what they would report.
THE DEFINITION THIS BRIEF WORKS FROM
Ehrenberg-Bass are right that buyers cannot articulate a meaningful difference. The neuroscience shows the difference is nonetheless operating on them — changing what they taste, what they will pay, and what they choose. Both are true, because they answer different questions. One asks what buyers can tell you. The other asks what is happening to them.
Asking a customer why they preferred something is like asking them to report their own blood pressure.
This is why brand shows up in the credit rating and not in the focus group. It is not persuasion. It is a change in the conditions under which a decision gets made — and it requires no one’s agreement.
FIGURE 02
The Two Schools, and the Bridge
Both schools are correct about different questions. One measures what buyers can say. The other measures what is happening to them.
SOURCE Romaniuk, Sharp & Ehrenberg, Australasian Marketing Journal, 2007 · McClure et al., Neuron, 2004 · Plassmann et al., PNAS, 2008.
CHAPTER III
The Cost Is the Message
Economists reached a version of this conclusion before marketers did, and by a different route.
In the 1970s Phillip Nelson observed something that should have embarrassed the advertising industry more than it did: a great deal of advertising conveys no information about the product at all. Why would a rational firm pay for it?
Paul Milgrom and John Roberts formalised the answer in the Journal of Political Economy in 1986. Expenditure that is visibly wasteful can be informative precisely because it is wasteful. A firm expecting repeat purchases can afford to burn money establishing itself; a firm selling something inferior, which will not see the customer twice, cannot recoup the outlay. The signal is credible because it is expensive.
The cost is the message. A brand investment that could have been made cheaply conveys nothing — because anyone could have made it.
THE IMPLICATION OF MILGROM & ROBERTS, 1986
This is why perception cannot be acquired at the speed most companies would like. If it could be, it would not be worth anything. It is also why the cheap, fast, high-volume approach to brand-building fails on its own terms rather than for reasons of taste: a signal that costs nothing to send carries no information.
What it converts into
Signalling theory predicts a price premium. The accounts confirm one. Three sets of audited figures, all published within the last twelve months.
Hermès reported 2025 revenue of €16.0bn and recurring operating income of €6.6bn — a recurring operating margin of 41%, up from 40.5%, despite adverse currency effects.
Ferrari reported 2025 net revenues of €7.15bn and an operating margin of 29.5%. It delivered 13,640 cars. Deliveries were deliberately held flat. The order book extends towards the end of 2027.
Volkswagen Group, in the same year, delivered approximately 9.0 million vehicles and generated €321.9bn in revenue — on an operating return on sales of 2.8%.
State the caveat first, because the comparison is worthless without it. Volkswagen’s 2025 was an unusually poor year, depressed by goodwill impairments, US tariffs and the cost of restructuring Porsche’s product strategy. Adjusted for those effects, the margin was 4.6% — and the company’s own CFO has said publicly that this is not sufficient in the long run. That is the fair number to compare against.
Volkswagen sold roughly 660 vehicles for every one Ferrari sold, and generated about 45 times the revenue. On the adjusted basis, Ferrari’s operating margin was still more than six times higher. Ferrari’s operating profit of €2.11bn was equivalent to nearly a quarter of the entire Volkswagen Group’s operating result of €8.9bn — from thirteen thousand cars against nine million.
Scale did not produce profitability. Perception did.
FIGURE 03
Volume Is Not Profitability
Volkswagen delivered roughly 660 vehicles for every one Ferrari sold. On Panel A, Ferrari is a bar 1.15 pixels wide — the honest width. On Panel B, it earns more than six times the margin. The gap between the two panels is the argument.
SOURCE Ferrari N.V., FY2025 Results press release, 10 February 2026. Volkswagen Group, Annual Report 2025. Volkswagen’s reported (2.8%) and adjusted (4.6%) margins are both shown; presenting only the reported figure would flatter the comparison and has been avoided.
Apple’s fiscal 2025 Form 10-K reports net sales of $416.2bn and a gross margin of 46.9%. In the same filing — in the risk factors, where a company is legally obliged to be candid — Apple states that it holds a minority market share in the global smartphone, personal computer, tablet and wearables markets.
A minority of the units. A disproportionate share of the profit. Written by the company itself, under penalty of securities law.
CHAPTER IV
What the Case Studies Actually Prove
IMAGE 02 — CHAPTER OPENER
SUBJECT Hands and material. A craftsman’s hands at work on leather, metal or wood — mid-gesture, not posed. Shot close. The face is irrelevant and should not appear.
WHY The argument is that cost IS the message. The image must show cost being paid — time, skill, attention — not the finished object.
TREATMENT High contrast, low saturation. Real, not licensed-stock-real. Wide, sits beneath the chapter title.
Case studies in branding are usually written backwards. The outcome is known, and the reasoning is reverse-engineered to explain it. This is survivorship bias, set in a handsome typeface.
What they do not prove
They do not prove that a strong brand guarantees growth. In the same year Interbrand recorded Hermès growing 18% in brand value — the strongest performance in its sector — it recorded Louis Vuitton, Gucci and Chanel all declining. Kantar recorded the luxury sector overall down 2% for 2025.
Sector membership is not a strategy. Neither is heritage.
What they do prove
Three principles, each transferable, none requiring a heritage or a Formula 1 team.
Scarcity is a decision, not a constraint. Ferrari could have sold more cars in 2025. It chose not to. Its chief executive framed the discipline explicitly in terms of exclusivity — describing Ferrari as a luxury company, and stating that an owner must be certain not many others can have what they have. Ferrari’s margin is not a consequence of demand. It is a consequence of what the company refused to do with demand.
Perception cannot be outsourced. Hermès attributes its performance to an exclusive, qualitative distribution network and strong vertical integration — that is, to controlling the conditions under which the customer encounters the brand. Every touchpoint a company does not control is one at which its perception is being set by someone with different incentives.
Volume and profit are separable. Apple concedes a minority market share in each of its principal categories while reporting a 46.9% gross margin. The volume leader and the profit leader are not the same company, and have not been for a long time. Chasing the first is the most common way to forfeit the second.
The uncomfortable common factor
What these three companies share is not creativity, or taste, or a beautiful identity system. Many companies have those and earn nothing from them.
What they share is refusal. Each holds a long and specific list of things it will not do, will not sell, will not discount, and will not appear beside — and each has held that list under commercial pressure, in public, for years, at a measurable short-term cost.
A brand is the accumulated evidence of what a company refused to do when it would have been profitable to do it.
WHAT THE CASE STUDIES HAVE IN COMMON
That is available to a company of any size. It is simply harder than it looks — because it must be paid for continuously, and it does not photograph well.
CHAPTER V
Final Reflection
Brand is not decoration.
It is one of the few assets a company can build that simultaneously raises what it can charge, reduces the volatility of what it earns, and improves the terms on which it can borrow — and continues to do all three for years after the investment was made.
It is also the only competitive asset that cannot be legally copied. The product can be reverse-engineered. The process can be hired away. The price can be undercut by anyone willing to earn less. The channel can be bought. The campaign can be imitated within a fortnight.
What cannot be replicated is being the company that people specifically want.
That is not an aesthetic position. It is an economic one — and it has an income statement attached to it.
It is why LACREM begins with perception, before production.
CONTINUES IN
Brief No. 002 — The Price of Being Forgettable
If perception is worth this much, what does its absence cost? On customer acquisition, excess share of voice, and why content cannot fix a positioning problem.
APPENDIX A
Definitions
Terminology used consistently across the LACREM Journal.
Brand
The accumulated set of perceptions, associations and expectations held about a company by the people who could buy from it, work for it, or lend to it. Not the identity system, which is a means of transmitting it.
Perception
What happens to a person when they encounter a brand — including effects they cannot report and would deny. Distinct from stated preference, which is what they will tell a researcher.
Distinctiveness
The ease with which a brand is noticed, recognised and recalled. Distinguished from differentiation, which concerns whether buyers believe the brand is meaningfully different. The evidence favours distinctiveness as the more reliable driver of choice (Romaniuk, Sharp & Ehrenberg, 2007).
Mental availability
The probability that a brand is thought of, or easily recognised, in a buying situation. Developed by the Ehrenberg-Bass Institute.
Pricing power
The capacity to sustain a price above the level a comparable undifferentiated offer would command, without proportionate loss of volume. The first economic consequence of perception.
Excess share of voice (ESOV)
The gap between a brand’s share of category advertising and its share of market. Identified by Binet & Field as the strongest single predictor of long-term growth. Examined in Brief No. 002.
Brand equity
The financial value attributable to the brand as an intangible asset, distinct from the tangible assets and operations of the business. Measured under ISO 10668 by Interbrand, and by a separate consumer-weighted methodology by Kantar BrandZ. The two produce materially different figures for the same brands — which is itself instructive.
APPENDIX B
Sources
Peer-reviewed research
01 Larkin, Y. (2013). "Brand perception, cash flow stability, and financial policy." Journal of Financial Economics, 110(1), 232–253. https://www.sciencedirect.com/science/article/abs/pii/S0304405X13001608
02 Madden, T. J., Fehle, F. & Fournier, S. (2006). "Brands matter: An empirical demonstration of the creation of shareholder value through branding." Journal of the Academy of Marketing Science, 34(2), 224–235. https://journals.sagepub.com/doi/abs/10.1177/0092070305283356
03 Romaniuk, J., Sharp, B. & Ehrenberg, A. (2007). "Evidence concerning the importance of perceived brand differentiation." Australasian Marketing Journal, 15(2), 42–54. https://www.marketingscience.info/wp-content/uploads/staff/2015/08/different.pdf
04 McClure, S. M., Li, J., Tomlin, D., Cypert, K. S., Montague, L. M. & Montague, P. R. (2004). "Neural correlates of behavioral preference for culturally familiar drinks." Neuron, 44(2), 379–387. https://www.cell.com/neuron/fulltext/S0896-6273(04)00612-9
05 Plassmann, H., O’Doherty, J., Shiv, B. & Rangel, A. (2008). "Marketing actions can modulate neural representations of experienced pleasantness." PNAS, 105(3), 1050–1054. https://www.pnas.org/doi/10.1073/pnas.0706929105
06 Milgrom, P. & Roberts, J. (1986). "Price and Advertising Signals of Product Quality." Journal of Political Economy, 94(4), 796–821. https://www.journals.uchicago.edu/doi/abs/10.1086/261408
Audited statements & regulatory filings
07 Hermès International (2026). 2025 Full-Year Results, 12 February 2026. Revenue €16.0bn; recurring operating margin 41%. https://finance.hermes.com
08 Ferrari N.V. (2026). FY 2025 Results, 10 February 2026. Net revenues €7,146m; EBIT margin 29.5%; shipments 13,640 units. https://www.ferrari.com/en-EN/corporate/articles/2025-full-year-and-fourth-quarter-financial-results
09 Volkswagen Group (2026). Annual Report 2025. Revenue €321.9bn; deliveries 8,984,000 units; operating return on sales 2.8% (4.6% adjusted). https://annualreport2025.volkswagen-group.com
10 Apple Inc. (2025). Form 10-K, fiscal year ended 27 September 2025. Net sales $416,161m; gross margin 46.9%. https://www.sec.gov/Archives/edgar/data/320193/000032019325000079/aapl-20250927.htm
Industry research — commercially produced
11 Interbrand (2025). Best Global Brands 2025: Radical Realities. · Kantar (2025). BrandZ Most Valuable Global Brands 2025. https://interbrand.com/best-global-brands/
Note on source 11. Interbrand and Kantar sell services related to their own findings. They are cited because their datasets are large and their methods partially disclosed. They are not independent, and this brief does not treat them as equivalent in weight to sources 01–10.